Data+Music
Data + Music was a community-driven campaign that brought together two universally loved subjects — data and music — to showcase the power and creativity of Tableau's analytics platform in an accessible, emotionally resonant way.
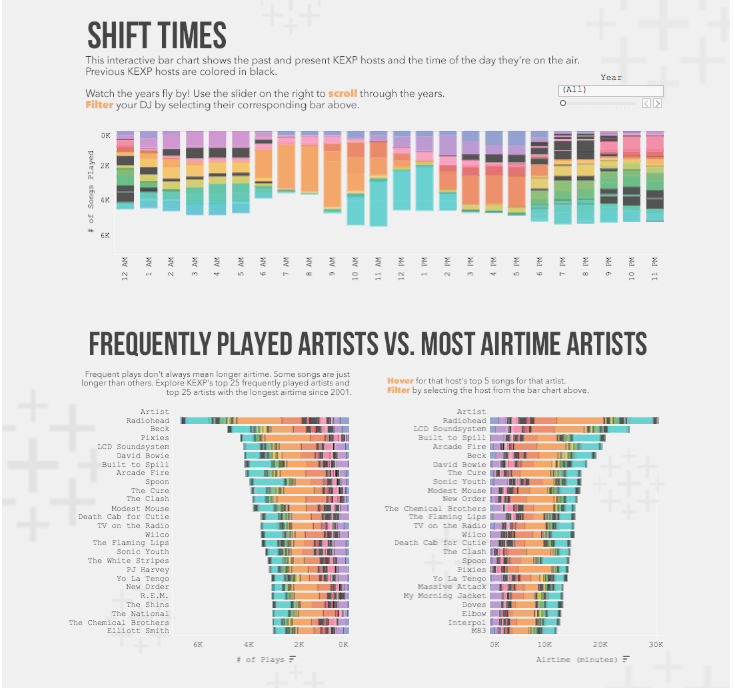
The campaign was built around a collection of visualizations produced by the Tableau community, showcasing the data behind favorite bands, songs, genres, tours, and music towns — stories of music that heal hearts, help people find their voices, and define generations. (more below)
With a free Tableau Public profile, anyone could visualize the story behind their favorite song, artist, or genre and share it with the world. This made the campaign highly participatory, turning Tableau's own user community into the content creators.
The visualizations covered a wide range of musical topics. Community members explored everything from the Beatles' songwriting history and K-Pop's most popular groups, to Fleetwood Mac's 50-year discography, heavy metal album analysis, and The Cure's global tour routes.
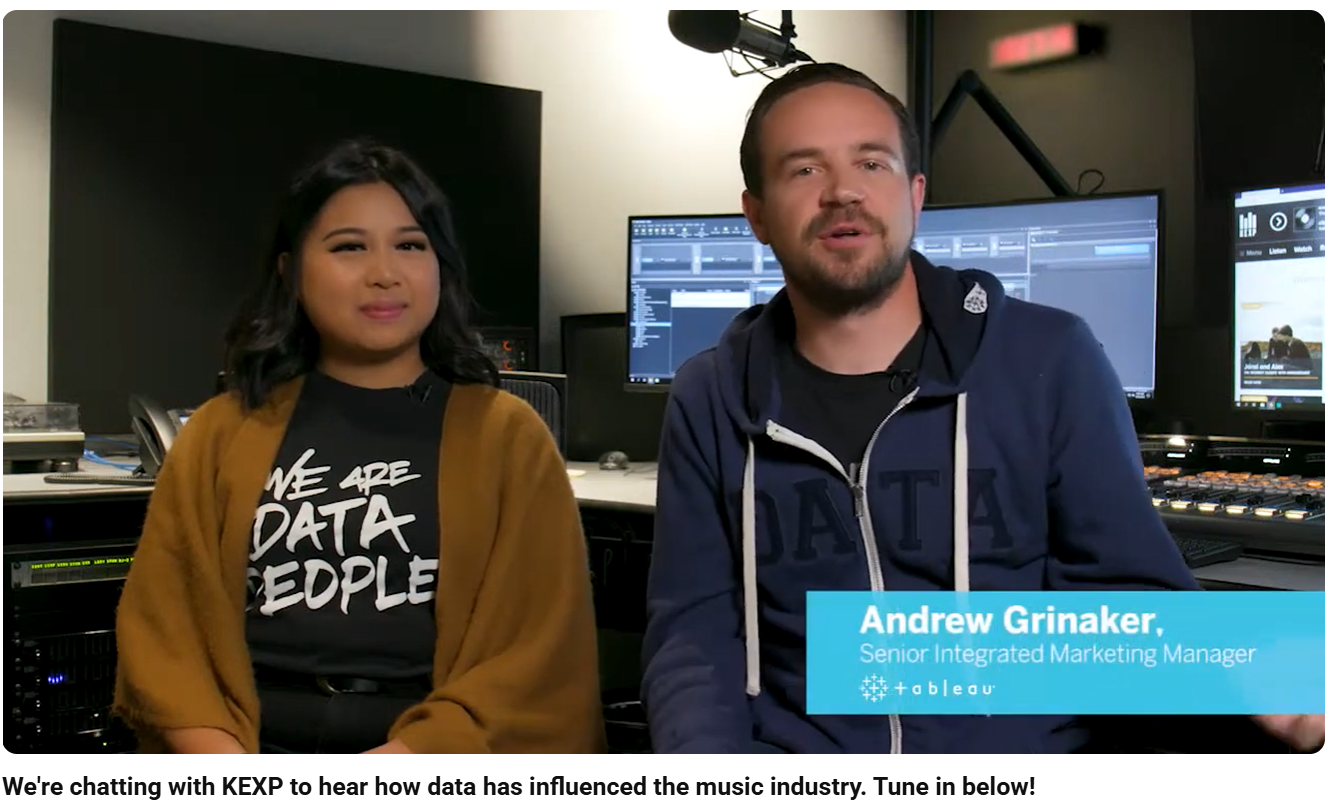
The campaign also extended into an educational webinar series. The Data + Music webinar series brought together top visual analytics experts from across the globe to explore the data behind music live, showing Tableau in action.
At its core, Data + Music was a brilliant brand awareness play — it demonstrated Tableau's capabilities not through dry enterprise use cases, but through something people genuinely cared about. It highlighted the Tableau Community's creativity, drove engagement on Tableau Public, and made data visualization feel fun, personal, and culturally relevant to a much broader audience.