Data Trends Campaign
What began as a blog post became one of the most recognized thought leadership franchises in the business intelligence industry. The Tableau Data Trends report launched in 2017 as an annual top-10 list of BI trends, with Tableau surveying its own brain trust — from engineers to product managers — to identify the business intelligence trends bound to go from idea to implementation.
By 2019, the report had matured into a fully designed content experience, expanding its scope to cover emerging territory like explainable AI, natural language processing, and data ethics — topics that were just entering mainstream business conversation at the time. And with the 2020 edition, the franchise made a significant leap — evolving from a list of BI trends into a comprehensive, multi-format report covering six major themes: Data Literacy, Artificial Intelligence, Data Storytelling, Data Equity, Data Culture, and Data Management. It was produced at a new level of editorial depth, spanning nearly 4,400 words and made available as a downloadable PDF, webinar, and slideshare to extend its reach across audiences and formats.
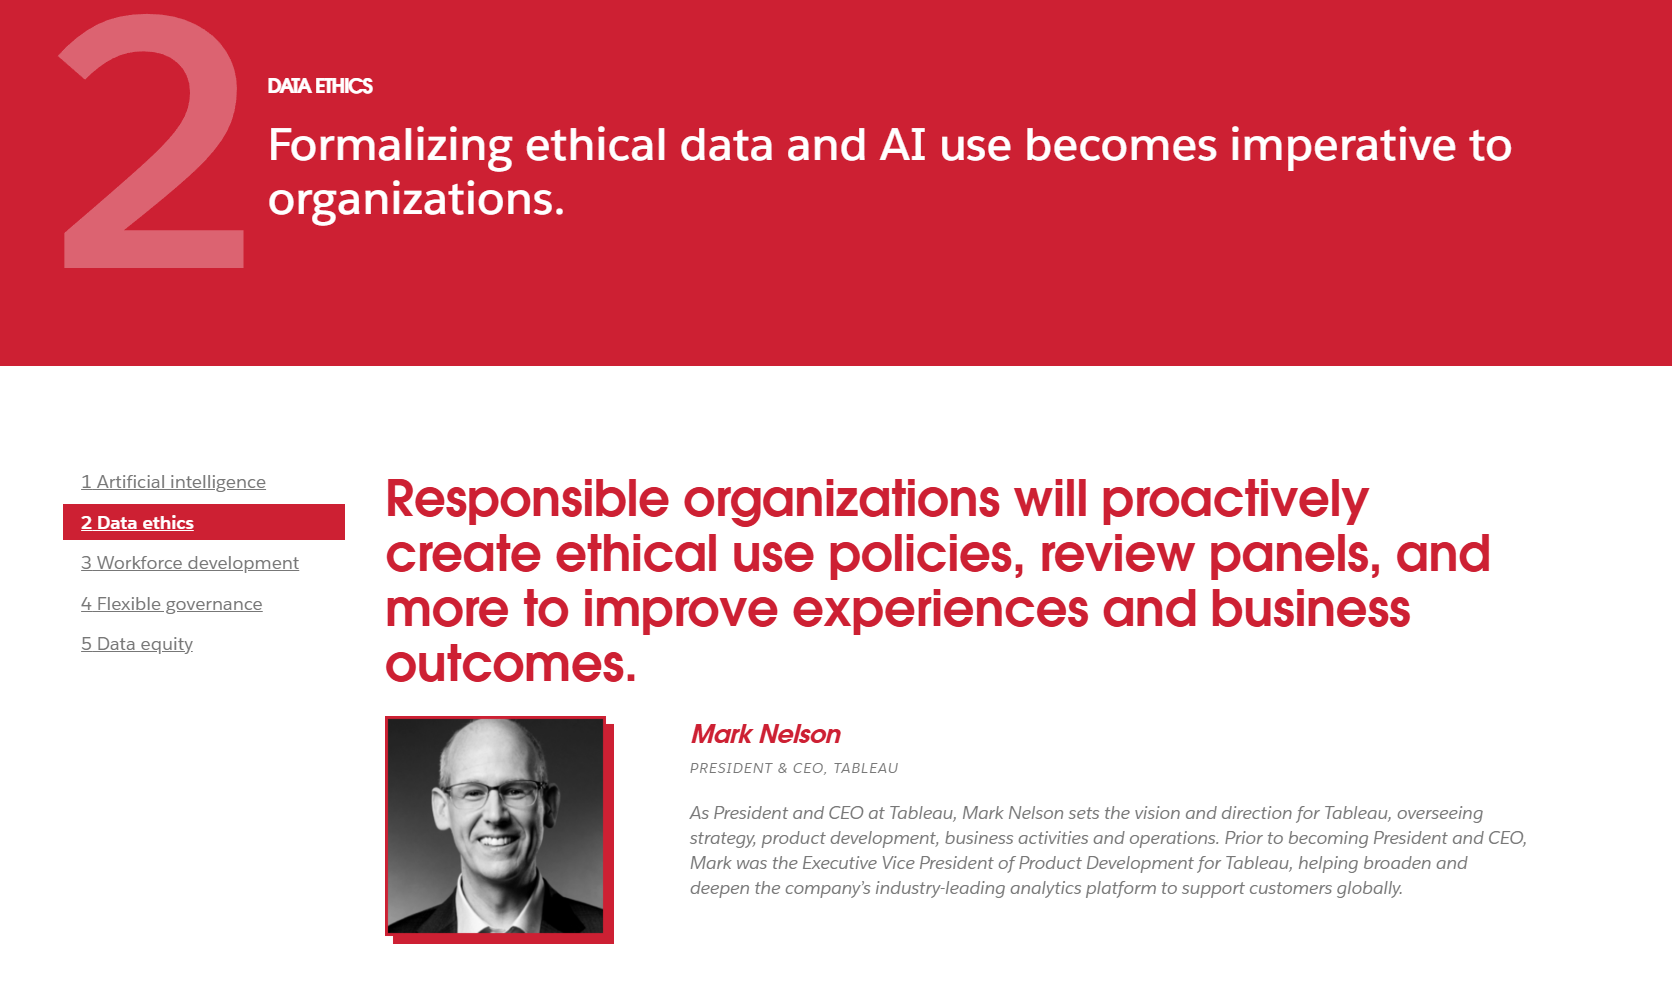
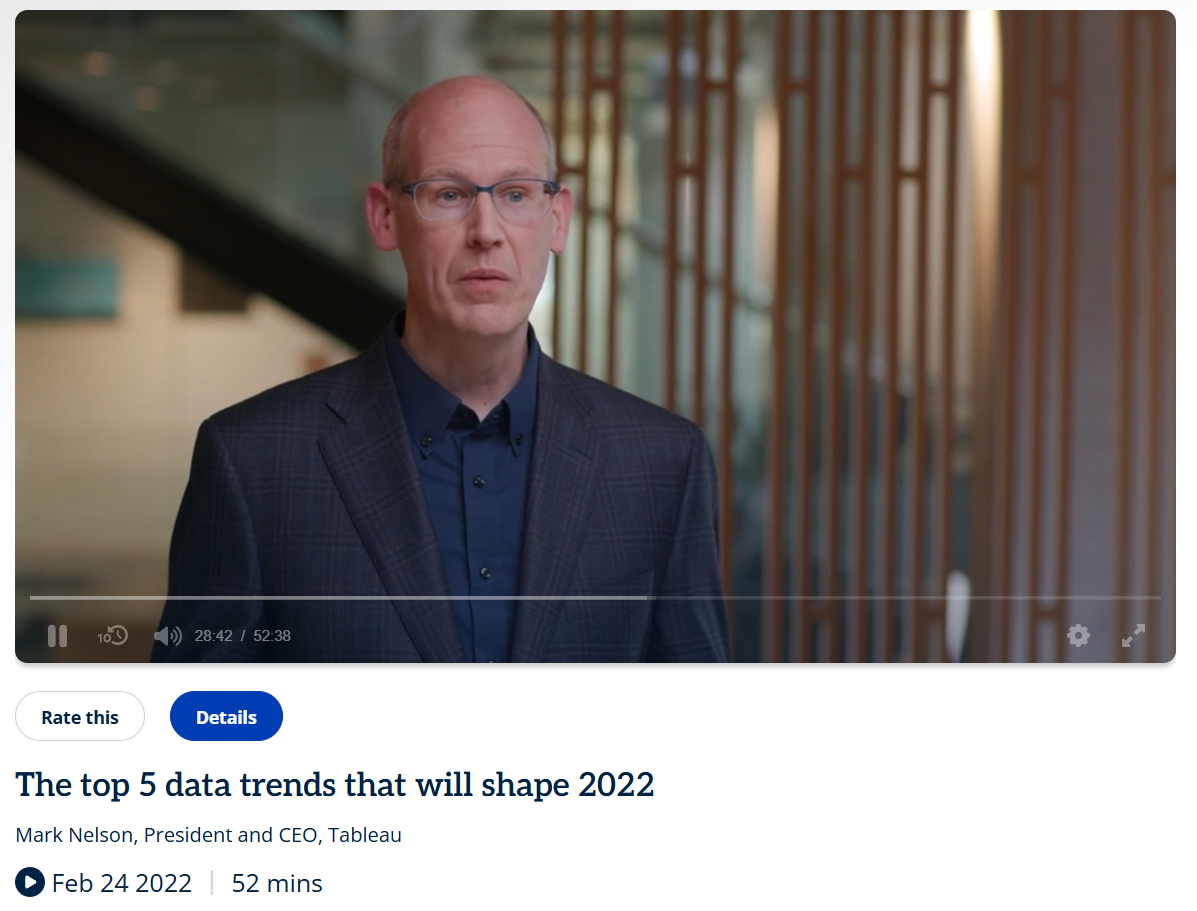
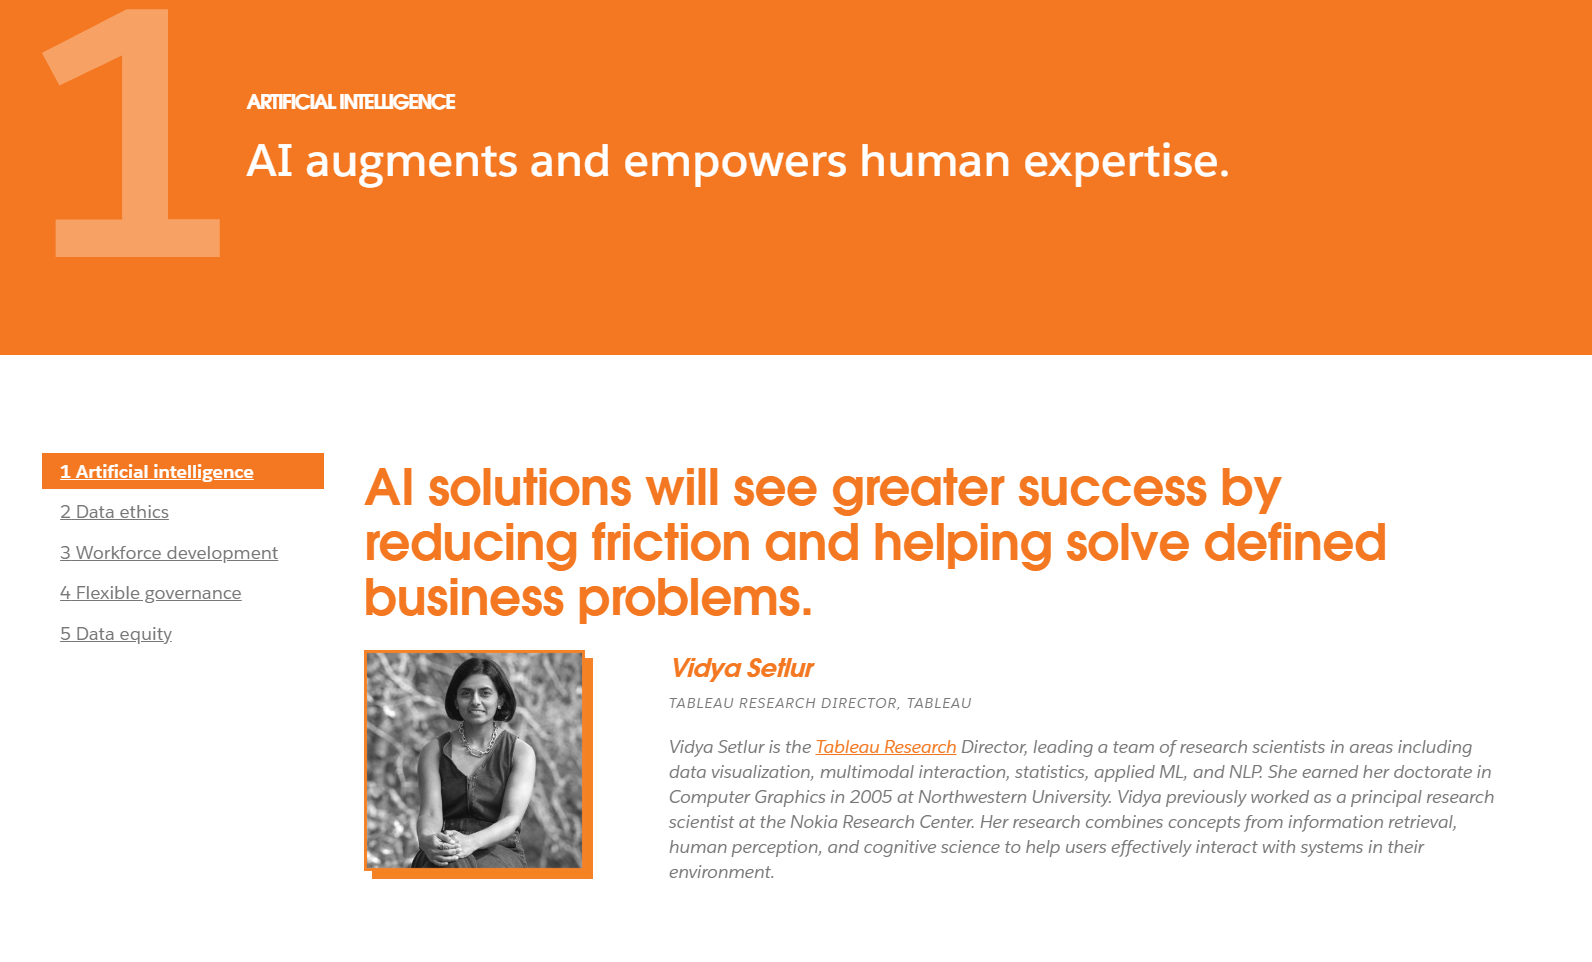
By 2022, the report had become a cornerstone of Tableau's brand identity — featuring executive and research voices from across the organization, third-party data from analysts like Gartner, Accenture, and IDC, and real-world customer stories that brought each trend to life. Topics like AI, data ethics, workforce development, and data equity positioned Tableau not just as a software company, but as a genuine authority on how data was reshaping business and society. Each edition was built to travel — driving webinar registrations, media coverage, social conversation, and deeper engagement with Tableau's global community of data professionals.na.